Reports
Overview
Having the newest insights of your store will never be easier, Magento 2 Reports is crafted as a reliable analyzing tool which assembles and performs your business operations onto easy-to-understand line charts. Thus, by keeping track precise collected data will definitely help you assess your business/campaign/program and flexibly adapt to new situations quickly.
In this extension, all the reports will use line graphs, which are fond of showing data variables and factors clearly. Advanced reports will be executed after scanning all sales records, display each of a specific variable into a line then perform its movement corresponding scanned records. Besides that, this module also helps store owners manage and follow the growth rate or the decreasing rate compared with the same period last month, last year, etc.
Download & Install
*Note: Magento 2 Reports can be used with multiple stores. Multiple stores module:
- This extension is applied to multiple stores.
- Stores are set the default as the Default Configuration.
- To change the configuration for each store, need to remove tick at Use Website on the right of each option.
- Config of the extension in each store will be applied in the store itself.
- Config in this store doesn't affect the config in the other store.
How to configure
Login to the Magento admin panel, choose Store > Settings > Configuration > Mageplaza Extensions > Reports
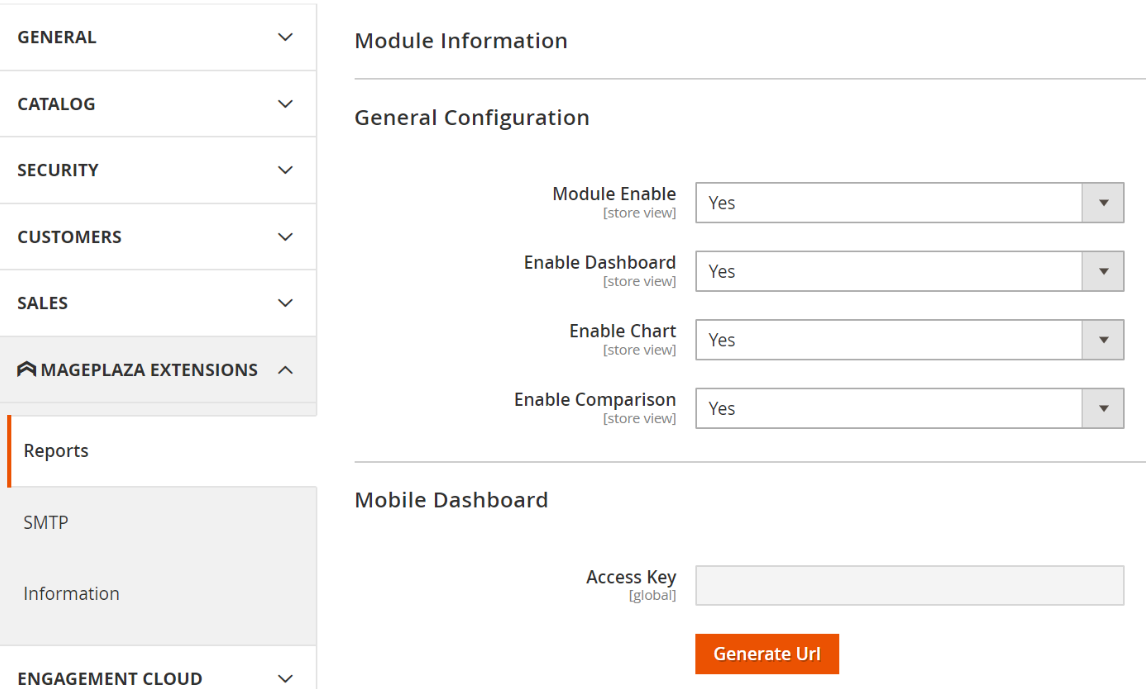
1. General
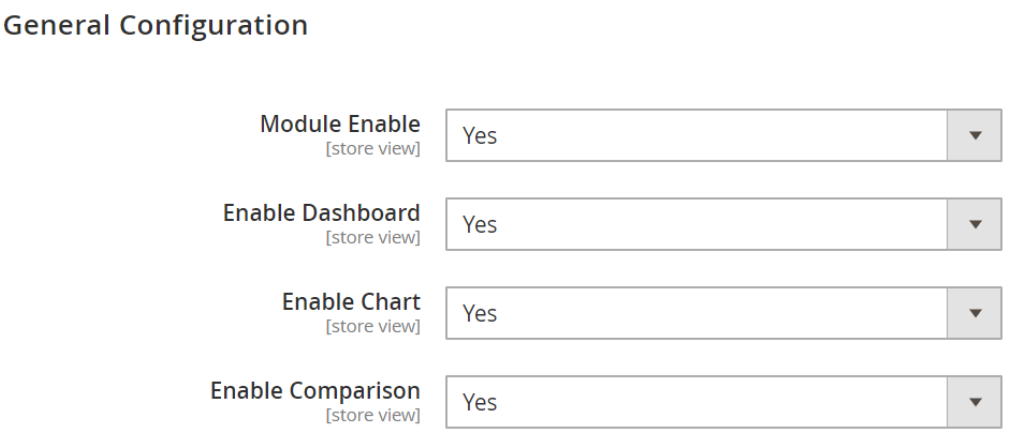
- In the Module Enable field: Choose
Yesto enable this module. - Enable Dashboard: Choose Yes to display Mageplaza Report extension at Dashboard
- In the Enable Chart field: Select
Yesto show the graph. - In the Enable Compare field: select
Yesto display the comparison.
2. Mobile Dashboard
This function allow mobiles access to admin Dashboard by Access Key. In Mobile Dashboard, there is no Magento menu, header, footer,...minimal the content to enhance the loading speed. Also, at Mobile Dashboard, admin can adjust the date like in Desktop.
Display outside the dashboard
After the configuration is completed, you will get the result displayed as the following image:
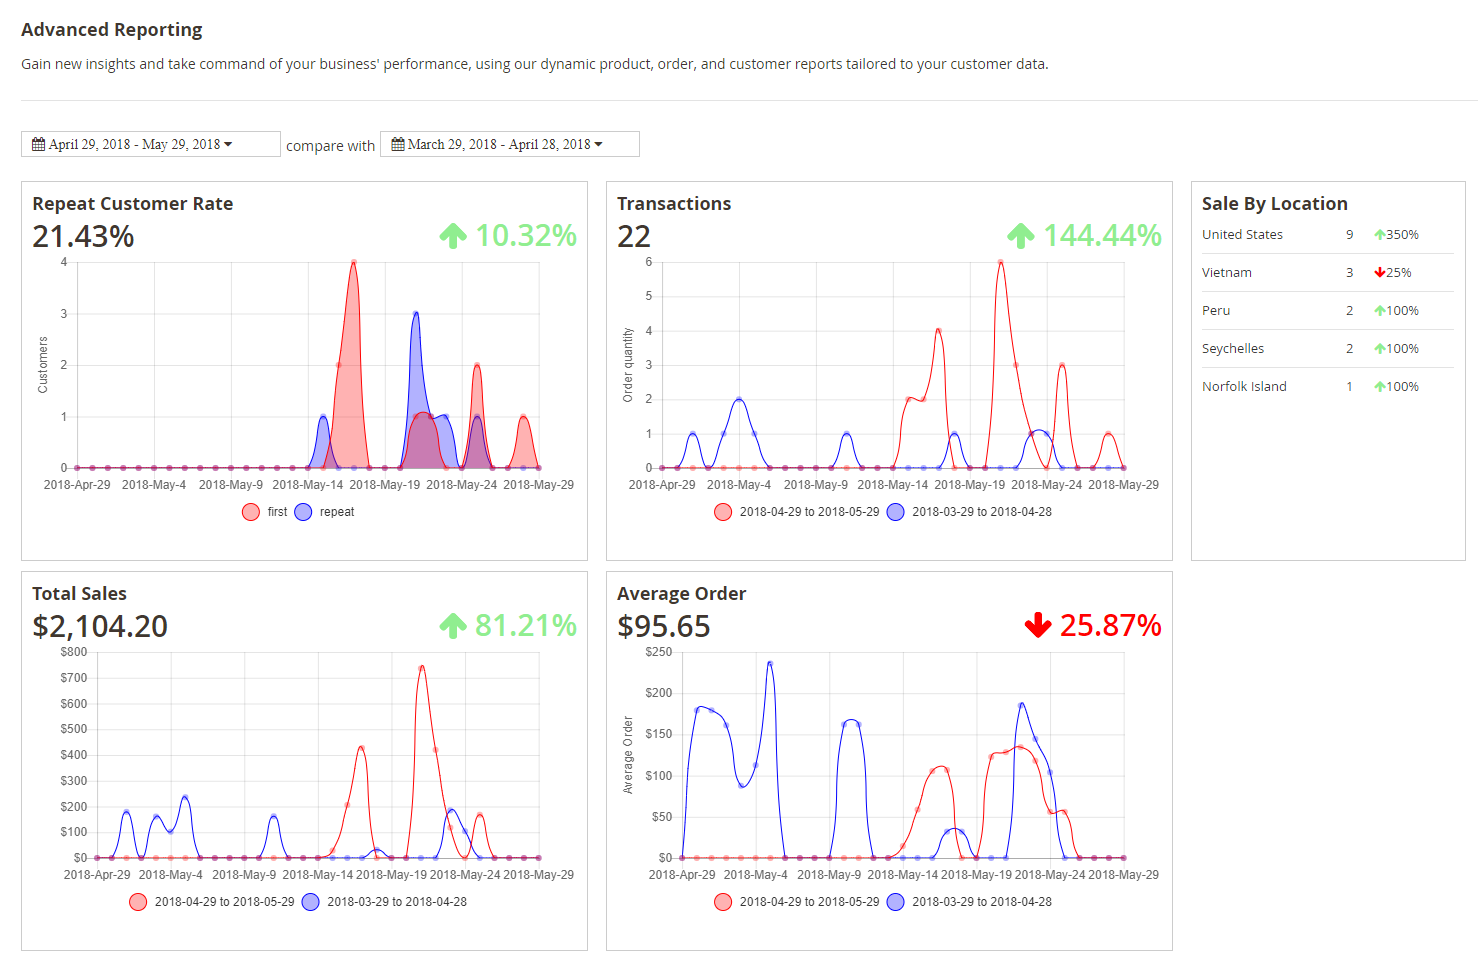
Dasboard Displaying
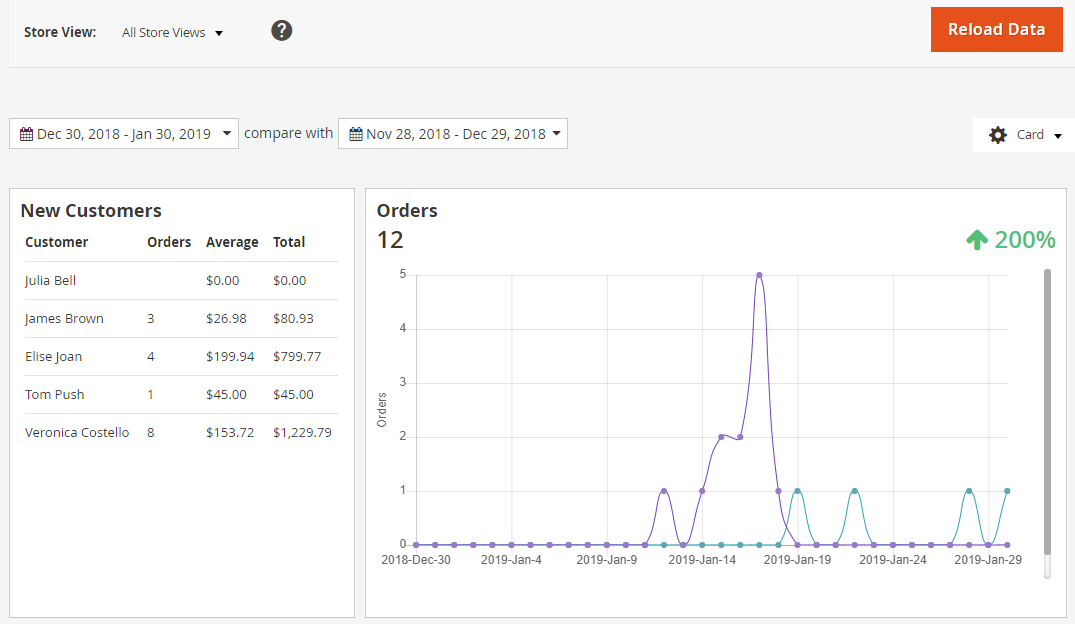
- The charts displayed at Mobile Dashboard include:
- Default report at Dashboard such as Lifetime Sales, Average Order, Last Orders, Last Search Terms, Top Search Terms, BestSellers, Most View Products, New Customer, Customers, Tax, Shipping.
- Moreover, Mageplaza provides additional mostly use reports:
- Orders
- Sales by Location
- Repeat Customer
- Totals
- Conversion Funnel
- Each Chart displays only 5 results typical for its criteria
- Each chart is represented by 1 card. Admin can adjust dashboard with cards provided by the module
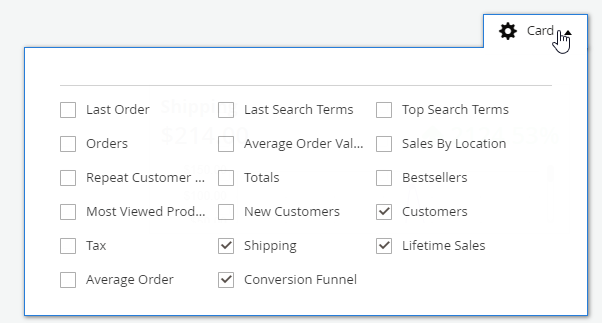
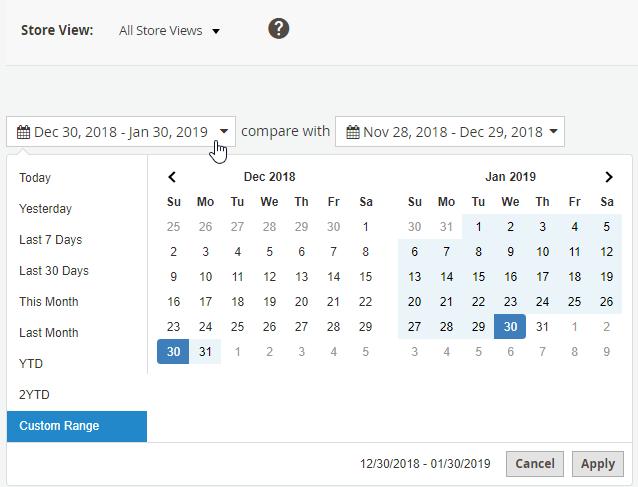
- Admins can also filter the results by the time period they want
Must-have extensions for your Magento stores
- Increase website traffic: SEO
- Build leads
- Increase conversion rates: One Step Checkout, Layered Navigation
- We believe that you can sell more: Gift Cards, Auto Related Products, Frequently Bought Together, Free shipping bar, Daily Deal , Product Feed
- Keep customers return: Reward Points
- Let your customer become raving fans
- Optimize your stores: PDF Invoice, Custom Order Number, Stop return items issue
3. Rest API
Mageplaza's Report extension supports using the Rest API to view the card information displayed in the dashboard as well as detailed statistics of the tables.
Details can be viewed here.
Instructions for creating Integration tokens here.
4. GraphQL
Run the following command in Magento 2 root folder:
composer require mageplaza / module-report-graphql
php bin / magento setup: upgrade
php bin / magento setup: static-content: deploy
To start working with Report GraphQL in Magento, you need to:
Use Magento 2.3.x. Return your site to developer mode
Install chrome extension (currently does not support other browsers)
Set GraphQL endpoint as
http://<magento2-3-server>/graphqlin url box, click Set endpoint. (e.g. http://develop.mageplaza.com/graphql/ce232/graphql)
View the supported queries here